

The numbers are in—no more guessing about growth levels or inflation rates for 2023. That is all in the rearview mirror (not counting upcoming adjustments to historical gross domestic product (GDP) growth rates). Many are suggesting the U.S. economy is experiencing a reasonably rare “Goldilocks” environment, meaning a “just right” level of inflation and growth.
2023 in Review
Let’s look at some core economic data for fourth quarter 2023 and the full year compared to longer-term trends.
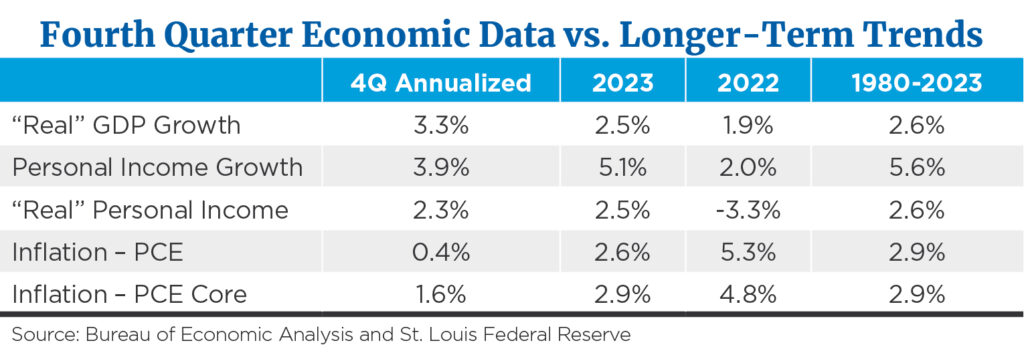
As we focus on 2023 (data is not yet finalized; revisions are forthcoming), we see that “real” GDP growth of 2.5% was close to the historical 2.6% rate. Growth in personal incomes grew nicely last year, somewhat in line with longer-term norms. This was the case no matter if we view income growth from a “nominal” or a “real” basis. In both cases, personal income growth was not far off longer-term normal levels. Based on historical norms, we can conclude that fourth quarter annualized growth wasn’t too “hot” nor too “cold,” but just right.
Turning to the inflation data, we see that inflation for 2023 declined nicely during the year from 5.3% during 2022 to 2.6% for 2023.1 Again, when we compare inflation realized during 2023 to longer-term averages, we find that it wasn’t too hot nor too cold during 2023.
Personal consumption expenditure pricing, the Federal Reserve’s preferred measure of overall price inflation, declined by 50% from the previous year. What about the momentum of inflation pressure? It is interesting to note that the most recent six-month (annualized) inflation rate was 1.9%.2 Of course, the Fed has highlighted its target inflation rate to be 2.0%. If one believes, as we do, that the back of higher inflation pressure has been broken, half of the Fed’s monetary policy mandate of steady prices is starting to be met.
Can a Goldilocks Economy Continue in 2024?
What of growth going forward? In our year-end work from last month, we expressed our view that overall real GDP growth was going to slow from the 2.5% level we saw in 2023 to an expected 1.5% to 2.0% for all of 2024. We believe the driver behind the decline in overall growth will prove to be weaker consumer spending growth levels.
We believe the consumer will slow overall growth in spending, but we don’t see an outright cut in spending. While real personal income growth showed improvement in 2023, spending growth (total personal outlays, which includes taxes and interest paid) rose by 6.8% for the year.3 The difference between growth in personal income and growth in personal outlays totaled $1.55 trillion,4 where consumers spent more than they took in during the year. The $1.55 trillion came from decreased savings and increased use of “revolving” debt, meaning credit cards. We don’t believe these sources of income are repeatable over the long term.
This all sounds rather glum, but the silver lining to a slowing in overall growth should lead to further declines in inflationary pressure and an eventual decline in interest rates. We continue to believe GDP growth in 2024 will come in at 1.5% to 2.0%, while inflation should register in the 2.0% to 2.5% range for the year. Our outlook for nominal GDP growth is 3.5% to 4.5%, down from the 5.1% level in 2023 and 7.3% in 2022.5
The issue of nominal GDP growth rates is important to understand, as there has been a historical tie between the growth rate in nominal GDP growth and corporate sales growth rates, the “mother’s milk” of rising corporate profits. Nominal GDP growth is basically economy-wide pricing (inflation) plus unit volume growth (real GDP growth), which is the same as top-line growth for most companies.
Quick Thought on Corporate Profit Growth
Over the long term (1980 to 2023), nominal GDP growth rates have averaged 5.5%.6 Over that period, S&P 500 corporate profits have grown by an average of 6.5% annually.7 The current consensus view is that the S&P 500 is expected to show earnings growth during 2024 of 10.5%.8 Yardeni Research shows expected earnings growth rates are 61% stronger than long-term averages. Nominal GDP growth tends to reflect top-line (sales or revenue) growth rates. If GDP growth is in the 3.5% to 4.5% range as compared to the long-term average of 5.5%, how probable is a greater than 10% gain in earnings growth when the long-term average of earnings growth has been 6.5%? We may see disappointment on the earnings front in relation to expectation as 2024 unfolds.
What could occur to offset this potential earnings growth disappointment? I suggest it may prove to be interest rate decreases, which would help stock prices by raising price-to-earnings (P/E) ratios on a broad-based level. That said, I don’t make stock market calls.
Economic Fundamentals On Track for Fed to Lower Rates in 2024
My bottom line—the highest probability I see on the horizon is for the economy to slow and for inflation to slowly continue its downward march. If this all plays out, I suggest a fairly high probability of the Fed lowering interest rates as the year unfolds. I am looking for the federal funds rate to trade at 4.0% to 4.25% by the end of 2024.
Sources:
1,2St. Louis Federal Reserve
3,4Bureau of Economic Analysis (BEA) database
5,6St. Louis Federal Reserve
7NYU Stern School
8FactSet data, according to Yardeni Research
The S&P 500 Index is a market capitalization-weighted index of 500 stocks designed to represent the performance of the leading industries in the United States economy chosen for market size and industry group representation. The index is unmanaged and cannot be directly invested into. Past performance is no indication of future results. Investing involves risk and the potential to lose principal.
This commentary is for informational and educational purposes only and is limited to the dissemination of general information pertaining to general economic market conditions. The views expressed are for commentary purposes only and do not take into account any individual personal, financial, or tax considerations. As such, the information contained herein is not intended to be personal legal, investment, or tax advice or a solicitation to buy or sell any security or engage in a particular investment strategy. Nothing herein should be relied upon as such, and there is no guarantee that any claims made will come to pass. Any opinions and forecasts contained herein are based on the information and sources of information deemed to be reliable, but we do not warrant the accuracy of the information that any opinion or forecast is based upon. You should note that the materials are provided “as is” without any express or implied warranties. Opinions expressed are subject to change without notice and are not intended as investment advice or to predict future performance. Actual results or developments may differ materially from those projected. Consult your financial professional before making any investment decision.
Mariner Advisor Network is a brand utilized by Mariner Independent Advisor Network (“MIAN”) and Mariner Platform Solutions (“MPS”). Investment advisory services are offered through Investment Adviser Representatives registered with MIAN or MPS, each an SEC registered investment adviser. Registration as an investment adviser does not imply a certain level of skill or training. MIAN and MPS comply with the current notice filing requirements imposed upon registered investment advisers by those states where they transact business and maintain clients. MIAN and MPS have either filed notice or qualify for an exemption or exclusion from notice filing requirements in those states. Any subsequent, direct communication by MIAN or MPS with a prospective client shall be conducted by a representative that is either registered or qualifies for an exemption or exclusion from registration in the state where the prospective client resides. For additional information about MIAN or MPS, including fees and services, please contact MIAN/MPS or refer to the Investment Adviser Public Disclosure website (www.adviserinfo.sec.gov). Please read the disclosure statement carefully before you invest or send money.
For information about which firm your advisor is registered with, please refer to the Investment Adviser Public Disclosure website (www.adviserinfo.sec.gov) or the Form ADV 2B provided by your advisor.
Investment Adviser Representatives are independent contractors of MPS or MIAN and generally maintain or affiliate with a separate business entity through which they market their services. The separate business entity is not owned, controlled by, or affiliated with MPS or MIAN and is not registered with the SEC. Please refer to the disclosure statement of MPS or MIAN for additional information.