

“And now you know the rest of the story.”
–Paul Harvey, Iconic American Radio Broadcaster
Stocks Took a Beating in April
There’s simply no doubt about it… April 2022 was an ugly month for U.S. stocks. The S&P 500 declined 8.8%,1—its worst month since the awful 35% swoon back in March 2020 at the peak of pandemic-related shock. The tech-laden Nasdaq fell 13% and turned in its poorest showing since October 2008 in the midst of the bursting of the housing bubble. As a result, the S&P 500 is down 13% as we move into the early days of May and squarely back in correction territory.2
What has taken the stock market to this lower level in early 2022? Is it simply a pause following the far-above normal annual returns over the last three years or is it the headline wall of worry items we are all reading about that are spooking investors and inspiring the pullback? Worrying items include elevated levels of inflation, Federal Reserve (Fed) rate hikes, ongoing conflict in Ukraine and angst over midterm U.S. election results this fall. Our answer is yes, to all of the above.
Market Reset Is to Be Expected
After the robust returns and other than March of 2020 abnormally smooth sailing investors experienced in 2019 2021, it is to be expected that the market will reset a bit, and we expect more normal levels of turbulence for some time. But more than that, a general fear of recession has risen significantly due to these latter wall of worry issues that the market must struggle through. At this moment, it would be quite easy for us to get caught up in the negative sentiment and lose focus on the facts and the data. For example, headlines have trumpeted the most recent inflation data as the “worst in four decades.” At first blush, this is true, but it’s not quite that simple… there’s more to the story.
Headlines Stoke Fear of Recession
Recent media reports have also suggested that the 1.4% decline in real gross domestic product (GDP) in the first quarter is a clear sign that recession is right around the corner. We come to completely opposite conclusions from those offered in such news reports when we go a bit deeper under the hood and closely examine the data contained in the releases regarding trends in inflation and GDP growth. In fact, our research efforts on these issues remind us of the late Paul Harvey who famously used the words, “And now you know the rest of the story,” when he would recount an intriguing life event on his many syndicated radio segments. During these broadcasts, he would outline a set of facts that led you to believe you knew exactly where he was headed with the ending. After setting up the story and going to commercial break, he would come back on the air and simply add one or two little facts he had purposely omitted that turned the whole episode on its head and resulted in an “aha” moment and the polar-opposite conclusion than you had anticipated before the commercial break.
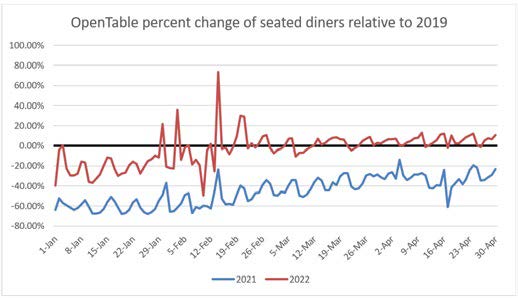
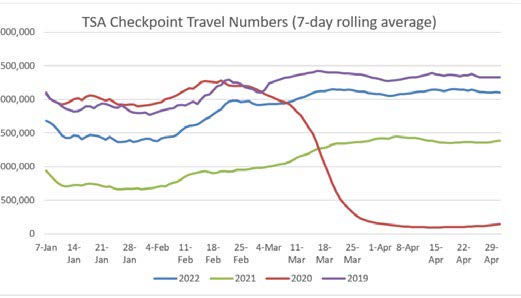
Similarly, we find the recent inflation data and GDP reports to not only be less threatening than many experts suggest, but we also find that they are telling a different story than depicted by the media and are signaling a solid and improving trend when we scratch below the surface. Certainly, the data isn’t stellar, and we aren’t out of a “show me” period quite yet, but the negativity appears overblown to us. The bottom line is that we believe the fundamentals of the market continue to skew to the positive as illustrated in the current earnings season in which 80% of S&P 500 companies are beating estimates and on pace for upwardly revised year-over-year earnings growth of ~8% for Q1 2022.3 The employment data—claims and the unemployment rate—are about as good as it gets. And the U.S. consumer is gladly spending. Check out the TSA airport traffic data or OpenTable reservations—no slowdowns there.
Factors Contributing to Elevated Volatility
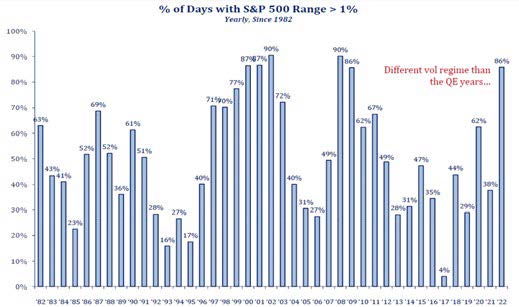
Valuation has actually become much more reasonable with the market now trading below 18 times earnings (the majority of stocks are selling below that level) versus the 22 times figure that held at year-end 2021.4 Couple this with negative investor sentiment and an abnormally high percentage of bears (a contrarian and positive signal), and this is a very nice cocktail for recovery and further advancement in stock prices as we push through the midterm elections and on into year-end 2022 and early 2023. Volatility should remain elevated due to the numerous transitions taking place this year ranging from:
- Abnormally low levels of inflation over the past two decades to a more normal pace of price increases in the coming years
- Historically aggressive Fed policy accommodation to more normal interest rate policies
- An era of a peace dividend to one of rising global conflict
- A shift from pandemic to endemic on the COVID-19 front
- Globalization to de-globalization in connection with supply chain management and trade
That said, we continue to believe these transitions will be managed in adequate fashion. Not perfectly, but in a way that avoids worst-case outcomes. For the most part, our message remains the same as the one delivered in our Crystal Ball Outlook back in January, given the positive underlying metrics cited above. Specifically:
- Expect positive yet more moderate equity returns in 2022
- Anticipate heightened volatility compared to what we saw in the 2019-2021 period and a correction of 15%-20% in 2022… importantly, don’t freak out
- Embrace the difference between a short-lived, albeit sizable, correction versus a deep, multi-quarter bear market
- If the strong market returns over the last three years have taken one of our client’s portfolios above the normal stock target, something we refer to as positive drift (a delightful problem!), make sure to have a conversation about trimming the portfolio back to a normal, long-term target.
We would add the following points to our current message:
- Clearly, we are in the midst of a correction, and it is sizable… to reiterate, this looks to be a short-term correction that we expected and not a longer, deeper bear market most often associated with recession. We do not see signs of a near-term recession that generally accompanies extended downdrafts. Should interest rates rise significantly above levels we expect (i.e., approach the 4% level on the 10-year Treasury bond), the risk of recession would increase, and we would become more cautious. If that were to occur, we could envision a scenario of flat-tomoderately- negative stock returns… these are lower probability, not base case, expectations scenarios at present.
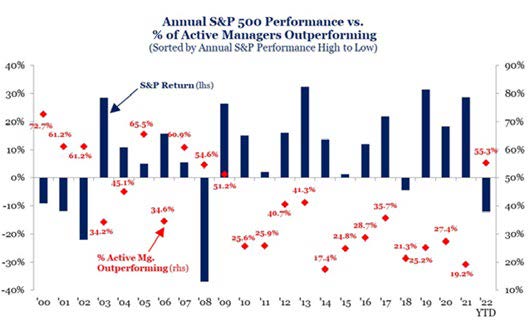
- As the Fed begins its efforts to normalize interest rates, and those rates rise to higher levels, and as earnings growth begins to moderate from the salad days of 2021 during the swift V-shaped recovery, companies’ balance sheets and business models will once again matter. No longer will a rising tide lift all boats, in our view. This is an environment when good old stock research and active stock selection can make a difference, as the chart below illustrates. It makes sense to us to include active management in a diversified portfolio and blend it with passive positions that may be held.
Trends in Inflation and Real GDP Growth— Channel Paul Harvey
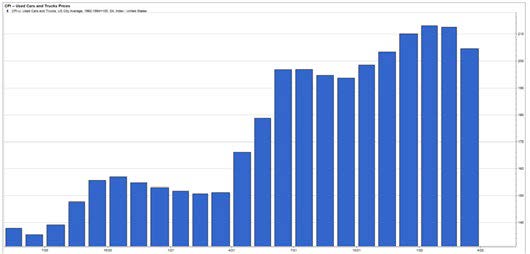
As mentioned earlier, recent news reports suggest the most recent inflation and GDP data is worsening and alarming. On the surface it looks that way, but that’s not so. Specifically, yes, the headline inflation data of 8.5% over the 12 months ending in March appears to be at a four-decade high. The problem with this blind statement is that the market knows inflation is high. It doesn’t care about absolute conditions; it cares about trends in those conditions. The actual story should have been that inflation moderated a bit in March. The chart below illustrates that we saw moderation in the CPI for key areas that had been significant contributors to inflation in prior months. For example, the CPI for used cars actually fell almost 4%. The price trend for commodities and energy has softened, and the housing market has softened. Let’s be careful about stopping at the headline and not looking deeper.
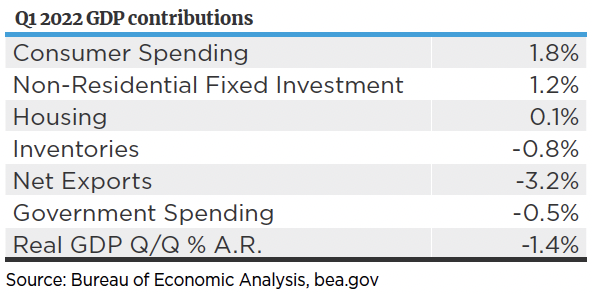
We suggest the same caution regarding jumping to conclusions on the title of articles about trends in real GDP growth. The table below shows that real GDP did shrink by 1.4% in Q1 of 2022, but that’s far from the whole story. The leading cause of the decline was that U.S. consumers and businesses felt so wealthy that they bought far more goods from foreigners than foreigners bought U.S. goods (U.S. consumers also feared recent COVID-related shutdowns in China might cause supplies to be even more scarce, so they ramped up purchases from troubled foreign countries). The second leading contributor was that U.S. inventory stockpiles were depleted. This unusual activity should reverse course and add to U.S. GDP in future quarters. The U.S. consumer and business investment were solid contributors to GDP this quarter.
These are great examples of maintaining a Paul Harvey perspective in evaluating the real story.
Our Take on Recession Risk
We agree with a lot of other folks in that there are cautionary yellow flags that deserve monitoring. That said, recession is not our base case in 2022. There are several indicators we follow that historically signal rising risk of recession and none of them are flashing red. The four key indicators we follow include:
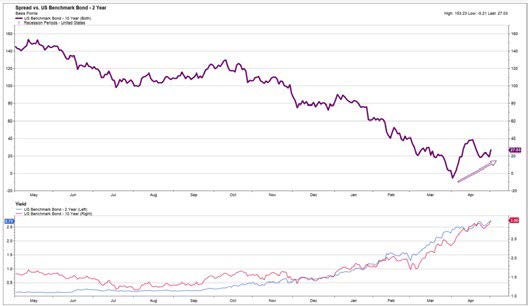
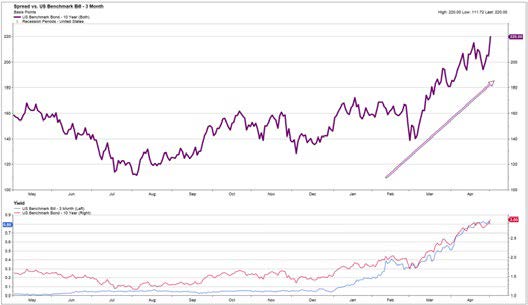
- Shape of the Yield Curve: It is flat, but not inverted. We look for both the 3-month to 10- year Treasury yield curve as well as the 2-year to 10-year to invert prior to recession. Neither are inverted at present. Even once inverted, there is an average lag of 16 months before recession occurs, historically.
Purchasing Managers Indices for Manufacturing and Service Sector Activity: Both fall below 50 prior to past recessions; both are comfortably above that level at present.
Leading Economic Indicators (LEI): The LEI stops advancing prior to past recessions. Currently it is advancing.
Trends in Employment: Historically, we see a meaningful rise in the unemployment rate (UR) in advance of recession… employment trends at present are quite strong, and the UR is close to very healthy pre-pandemic levels.
In addition, the credit markets are quite stable in the U.S. It simply is not normal to see a recession ensue with strong earnings, credit and employment. We may see a slowdown that feels like a mild recession, but that should not derail the stock market.
Wrap-Up
As a long-time runner (now jogger), I have adopted a life philosophy that has served me well: “Life is not to the swift, but to those who keep on running.” I think this can apply to the stock market as well. Sometimes the training run or race feels too easy to be true—success comes seemingly with little pain or sacrifice. That’s what we experienced in 2021. It’s not quite so fun when the pain sets in, but if the fundamental training work laid out in the past and the foundation are still there, one can push through the pain and still celebrate a winning effort. Not perfect, not so fun, but success nonetheless. In this midterm year, that’s our sense of the type of market we are in. A more active approach and attention to detail this year are, in our mind, required to perform well. Thanks for trusting us to help you achieve your goals and manage through a transitional time.
Sources:
1,2,3,4 FactSet
The S&P 500 Index is a market-value weighted index provided by Standard & Poor’s and is comprised of 500 companies chosen for market size and industry group representation.
The Nasdaq Composite Index is the market capitalization-weighted index of over 3,300 common equities listed on the Nasdaq stock exchange.
Indexes are unmanaged and cannot be directly invested into. Investing in securities involves risk, including loss of principal.
The impact of COVID-19, and other infectious illness outbreaks that may arise in the future, could adversely affect the economies of many nations or the entire global economy, individual issuers and capital markets in ways that cannot necessarily be foreseen. The duration of the COVID-19 outbreak and its effects cannot be determined with certainty. This commentary is limited to the dissemination of general information pertaining to Mariner Wealth Advisors’ investment advisory services and general economic market conditions. The views expressed are for commentary purposes only and do not take into account any individual personal, financial, or tax considerations. As such, the information contained herein is not intended to be personal legal, investment or tax advice or a solicitation to buy or sell any security or engage in a particular investment strategy. Nothing herein should be relied upon as such, and there is no guarantee that any claims made will come to pass. Any opinions and forecasts contained herein are based on information and sources of information deemed to be reliable, but Mariner Wealth Advisors does not warrant the accuracy of the information that this opinion and forecast is based upon. You should note that the materials are provided “as is” without any express or implied warranties. Opinions expressed are subject to change without notice and are not intended as investment advice or to predict future performance. Past performance does not guarantee future results. Consult your financial professional before making any investment decision.
Disclosures
The views expressed are for commentary purposes only and do not take into account any individual personal, financial, or tax considerations. It is not intended to be personal legal or investment advice or a solicitation to buy or sell any security or engage in a particular investment strategy. Investment advisory services provided through Mariner Platform Solutions, LLC (“MPS”). MPS is an investment adviser registered with the SEC, head quartered in Overland Park, Kansas. Registration of an investment advisor does not imply a certain level of skill or training. MPS is in compliance with the current notice filing requirements imposed upon registered investment advisers by those states in which MPS transacts business and maintains clients. MPS is either notice filed or qualifies for an exemption or exclusion from notice filing requirements in those states. Any subsequent, direct communication by MPS with a prospective client shall be conducted by a representative that is either registered or qualifies for an exemption or exclusion from registration in the state where the prospective client resides. For additional information about MPS, including fees and services, please contact MPS or refer to the Investment Adviser Public Disclosure website (www.adviserinfo.sec.gov). Please read the disclosure statement carefully before you invest or send money. Investment Adviser Representatives (“IARs”) are independent contractors of MPS and generally maintain or affiliate with a separate business entity through which they market their services. The separate business entity is not owned, controlled by or affiliated with MPS and is not registered with the SEC. Please refer to the disclosure statement of MPS for additional information.