

Be curious, not judgmental.”— attributed to Walt Whitman.
The nice break in January represented a respite from negative karma in 2022. The S&P 500 surged more than 6% in January, and leadership clearly centered on the more aggressive areas of this large-cap index. Consumer discretionary and technology stocks advanced more than 9% each.1 The losers of 2022 were the winners in 2023’s first month. The other more volatile U.S. stock indices, such as the tech-laden Nasdaq and the small-cap-oriented Russell 2000, well outpaced the S&P 500.2 While these were good signs of rising investor confidence and resurging risk-on appetites, it didn’t last long.
February’s Glum Returns
As can often occur in transitional periods, emotions seemed to get a little ahead of themselves in January. The giddy mood, not surprisingly, has gone temporarily dormant. This was evidenced by both disappointing market returns in February and by various measures of investor sentiment revealing a renewed retreat in investor confidence. In February, the S&P 500 slipped by 2.6%, giving back some of those January gains.3 On the psychology front, we saw a significant shift in the percentage of bulls versus bears reported in the recent American Association of Individual Investors Survey. There was a whipsaw effect in January and February in the sentiment figures. Self-reported bulls had risen significantly from trough levels in December of 2022 and had climbed back to almost average historical levels by the early days of February. These have now fallen back to lower levels, with only 22% of folks declaring themselves as bullish in mood at present.4
February’s Inflation Data
Investors who had confessed they were preparing for a stock market wake at the end of 2022 suddenly said they were readying for a celebration of life and prognosticating “clear sailing ahead” in less than a couple of weeks in early 2023. This was inspired by the marked improvement in the inflation data released in early January and Federal Reserve Chair Jerome Powell’s related comments in the Federal Reserve’s early February presser that the central bank committee had seen some embryonic signs of “disinflation.” He used this term multiple times in his press conference. Unfortunately, it’s just not that simple or quick. Positive investor vibes were undone in minutes as the mid-February inflation data was a tad disappointing—not horrible by any stretch—just not as good as expected. It continued to demonstrate a calming trend year over year, just not fast enough to satisfy the crowd. This, coupled with some associated hawkish speeches by selective committee members at the Fed and by stronger-than- expected U.S. economic data, created fear inflation might persist at higher levels and for longer than desired or for longer than what is healthy for the economy and financial markets.
Recovery Doesn’t Happen Overnight
Our take on this roller-coaster behavior in market returns and investor psychology? Recovery is a process, particularly when the economy is experiencing so many transitions at once.
Those transitions include going from:
- A V-shaped recovery to more moderate growth
- Eerily low inflation for decades to something higher
- Free trade and rapid globalization to deglobalization and re-onshoring of supply chains in the U.S.
- Decades of benefiting from free trade, a global mobile workforce and build out of supply chain infrastructure, known as “peace dividend benefits,” to a period of rising regional conflict and challenge of U.S. supremacy as the global order
These transitions should be adequately managed, in our view, but they will take time and foster elevated volatility and stock market churn until successful resolution becomes clearer.
Economy Is Slowing, Not Falling Off a Cliff
We could continue to be stuck in a trading range for several more months or quarters before all is said and done. We expect decent returns for the year and look for an S&P 500 price level of 4,500+ by year-end. We also expect more bearish investors and more hawkish Fed members to continue growling and capturing headlines. However, within a reasonable time frame we believe that policy makers and other market participants overall will agree with us that the economy is slowing, not falling off a cliff, and that inflation is in a sustainable calming trend. Patience is required, near term, as monthly inflation releases reflect fits and starts in delivering progress as quickly as desired, but soon they should demonstrate that there has been sufficient progress to satisfy the key decision makers at the Fed. We may see a mild recession as a by-product of Fed action, but the slowdown should be light and shallow, allowing P/E multiples to expand on earnings that are lower than originally expected but not terrible.
Growth-Oriented Areas Lead the Market
Yes, February returns were negative, but leadership is still coming from the more growth-oriented areas of the market such as technology and consumer discretionary sectors, not the defensives like utilities and staples that typically lead in extended bear market periods.5 The economy is amazingly resilient at present as captured in the employment data as well as in consumer and capital spending. We did not see a cluster of ugly signs of selling and distribution in February, generally evidenced by declining stocks well outnumbering advancing stocks at ratios of 6 to 1 or greater like we saw in the failed rallies in 2022.6 This makes us believe the probability that a bottom or low in the S&P 500 that had been set at the 3,500 level back in October of 2022 has risen and that a floor has been established at higher levels than originally feared, even if stock market chop continues for a bit.7
2023 Is Likely to Be the Inverse of 2022
2022 was a year of continued economic expansion and earnings growth, yet a horrible stock market. 2023 is likely to be a year when we finally get the slowdown in the economy and earnings, yet we have a healthy stock market. In its anticipatory nature, the market already declined in 2022 as it sensed a slowdown in 2023. Similarly, the market should recognize the slowdown is not as bad as feared and anticipate the recovery as we move through the year and into 2024 and rise in advance.
The Bulls and the Bears
Bears will say, “The market was only down 25% peak to trough in 2022, and we haven’t even seen a recession yet or the extensive negative earnings revisions that are likely to come as a result. We’ve got a meltdown in front of us.” Our response to this is linked to the point above on the stock market being forward looking. The stock market and economy are two separate animals, with the former anticipating where the puck is going, and the latter merely being a snapshot in time. The market looks for trend and movement. Economic data, on the other hand, is reported in absolutes and with a lag. Economic metrics tend to be rearview mirror in nature. The market fell 25% last year in anticipation of a recession in 2023 that may or may not happen. Interestingly, this is almost exactly the decline that occurs during mild recessions per data going back to 1929.8
One of the major bear arguments is that earnings growth might go negative. Bears suggest that if earnings go negative in 2023, the market will also and in a big way. Check out history, which says otherwise. In nine of the past 11 calendar years in which S&P 500 earnings have declined by more than 10%, the market has generated positive and generally double-digit returns.
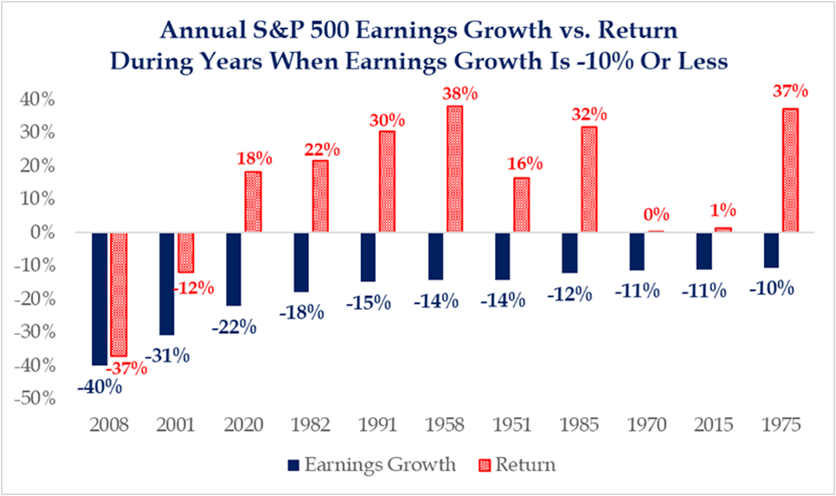
Source: Strategas
Again, this is because the market is focused on the trend and looking to recovery. As the earnings were becoming less negative as time evolved in most of these years above, the market was already looking for better things to come in the following year. Interestingly, the market advances in the midst of recession roughly half of the time.9 The pandemic year of 2020is a great example of this decoupling of earnings growth and stock market returns in the short term. We had a major but short-lived recession in 2020 that caused S&P 500 earnings to drop 22%. Yet, the S&P 500 advanced 18% in that economically ravaged year of forced shutdown. Why, you ask? The stock market anticipated the earnings recovery in 2021.
We simply don’t think this bearish assertion that earnings and returns are tightly correlated in the short term is correct. If that is so, how do you explain the above table or market behavior in 2022? Last year, the market tanked regardless of continued economic expansion and earnings growth. The market fell as P/E’s contracted in the midst of a sharp rise in rates. Similarly, the market could ignore a slowdown in earnings and the economy this year as it focuses more on the trend in inflation and rates. Price to earnings could expand if rates stabilize at lower than peak levels currently feared.
Wrap-Up
We have three major thoughts:
- Exercise patience until the inflation data paints a clearer picture that the trend continues to get better.
- Embrace active management as solid research can uncover a number of mispriced stocks. We find active strategies more appealing than a solely passive approach at this juncture.
- “Hold your ground” and wait to “buy on the dips” until later in the year. By hold your ground, we mean one should hover at their targeted, long-term strategic allocation to stocks, not buy above this level nor sell down below it.
Patience is paramount at present. Like you, we struggle to exercise it as best we should. We prefer positive market returns for our clients. We have financial plans and 401(k) plans, just like you. Stalled trading ranges like this try one’s soul. But the data keeps us patient and in this hold-your-ground zone with strong conviction.
Ask Questions and Dig Deeper
This urge to go negative and assume worst-case outcomes in the transitional issues facing the economy at present needs to be checked at the door. The press preys on our negativity bias. Negative news sells much more than positive. The quote above is spot on. “Be curious, not judgmental.” For Ted Lasso fans, the actor Jason Sudeikis, who plays Ted in the popular sitcom on Apple TV+, embraces this quote in a dart-game scene in season one. Look up the scene if you are curious (pun intended). It will resonate even if you don’t watch the show. In that scene, we are encouraged not to take things at face value but to ask questions and dig deeper.
The headlines say inflation is worse than it has been in decades. We think they should say instead that inflation isn’t perfect but that it peaked roughly a year ago, following a crazy pandemic period that caused massive supply chain bottlenecks, which are now getting solved. The news might go on to say that consumer durable goods inflation peaked at 10.5% in February 2022 and that inflation was down to 1.1% during January on a year-over-year basis. The news could tell you that consumer nondurable goods (including food and energy) peaked at 13.2% during June of 2022 and was down to 7% at the latest read.10 The news might even go on to tell you that the reason the Consumer Price Index (CPI) ticked up a tad on a month-over-month basis in the February release was because of the rather confusing way the government recalculated the basket of goods used to derive the number. The data isn’t an apples-to-apples comparison to prior data.
The news probably should inform readers that new rents—a big component that temporarily pushed inflation higher—are disinflating swiftly as multifamily/apartment construction has been on a tear. But the press won’t tell you this—that’s too informative and accurate. The Fed knows it, though, and eventually the data should win out if it continues to trend and improve as it is. That’s our take.
We have another set of data releases before the next Fed decision at the end of March. Let’s see where that set of facts takes us before rendering additional judgment. In the interim, hold your ground.
Definitions
The S&P 500 Index is a market-value weighted index provided by Standard & Poor’s and is comprised of 500 companies chosen for market size and industry group representation.
The Nasdaq Composite Index is the market capitalization-weighted index of over 3,300 common equities listed on the Nasdaq stock exchange.
The Russell 2000 index is an index measuring the performance of approximately 2,000 smallest-cap American companies in the Russell 3000 Index.
Footnotes
1,2,3FactSet
4American Association of Individual Investors and FactSet Data
5,6,7,8FactSet
9YCharts
10Bureau of Economic Analysis and FactSet Data
Disclosures
This commentary is limited to the dissemination of general information pertaining to general economic market conditions. The views expressed are for commentary purposes only and do not take into account any individual personal, financial, or tax considerations. As such, the information contained herein is not intended to be personal legal, investment, or tax advice or a solicitation to buy or sell any security or engage in a particular investment strategy. Nothing herein should be relied upon as such, and there is no guarantee that any claims made will come to pass. Any opinions and forecasts contained herein are based on the information and sources of information deemed to be reliable, but Mariner Advisor Network’s does not warrant the accuracy of the information that any opinion or forecast is based upon. You should note that the materials are provided “as is” without any express or implied warranties. Opinions expressed are subject to change without notice and are not intended as investment advice or to predict future performance. Consult your financial professional before making any investment decision.
Indexes are unmanaged and cannot be directly invested into. Investing involves risk and the potential to lose principal. Past performance does not guarantee future results.
Mariner Advisor Network is a brand utilized by Strategic Wealth Advisors Group (“SWAG”) and Mariner Platform Solutions (“MPS”). Investment advisory services are offered through Investment Adviser Representatives registered with SWAG or MPS, each an SEC registered investment adviser. Registration as an investment adviser does not imply a certain level of skill or training. SWAG and MPS comply with the current notice filing requirements imposed upon registered investment advisers by those states where they transact business and maintain clients. SWAG and MPS have either filed notice or qualify for an exemption or exclusion from notice filing requirements in those states. Any subsequent, direct communication by SWAG or MPS with a prospective client shall be conducted by a representative that is either registered or qualifies for an exemption or exclusion from registration in the state where the prospective client resides. For additional information about SWAG or MPS, including fees and services, please contact SWAG/MPS or refer to the Investment Adviser Public Disclosure website (www.adviserinfo.sec.gov). Please read the disclosure statement carefully before you invest or send money.
For information about which firm your advisor is registered with, please refer to the Investment Adviser Public Disclosure website (www.adviserinfo.sec.gov) or the Form ADV 2B provided by your advisor.
Investment Adviser Representatives are independent contractors of MPS or SWAG and generally maintain or affiliate with a separate business entity through which they market their services. The separate business entity is not owned, controlled by, or affiliated with MPS or SWAG and is not registered with the SEC. Please refer to the disclosure statement of MPS or SWAG for additional information.